
A Simple Profit and Loss Template That Builds Itself
A profit and loss statement (P&L) answers the one question every business owner actually cares about: am I making money? You don't need accounting software to produce one — a well-built spreadsheet does it, and it's easier to understand because you can see every formula.
The structure of a P&L
A P&L flows top to bottom, each line building on the last:
- Revenue — everything you sold
- − Cost of Goods Sold (COGS) — the direct cost of what you sold (materials, stock)
- = Gross Profit — what's left to run the business
- − Operating Expenses — rent, software, marketing, the day-to-day
- = Operating Profit
- − Other costs (interest, one-offs)
- = Net Profit — the real bottom line
The reason to split costs into COGS vs operating is gross margin — it tells you whether the thing you sell is fundamentally profitable before overheads. That's a number worth watching.
Building it in a spreadsheet
Log every sale and cost on a transactions tab with a category and a type (COGS / Operating / Other).
Then the P&L tab is just a stack of =SUMIF() formulas pulling each category into the right line, with
subtractions between them. Add a monthly view with SUMIFS() and you can watch margin trend over time.
The tricky bits are getting the COGS-vs-operating split right and adding sales-tax/GST tracking without double-counting — which is where DIY P&Ls usually get messy.
Or use a ready-made one
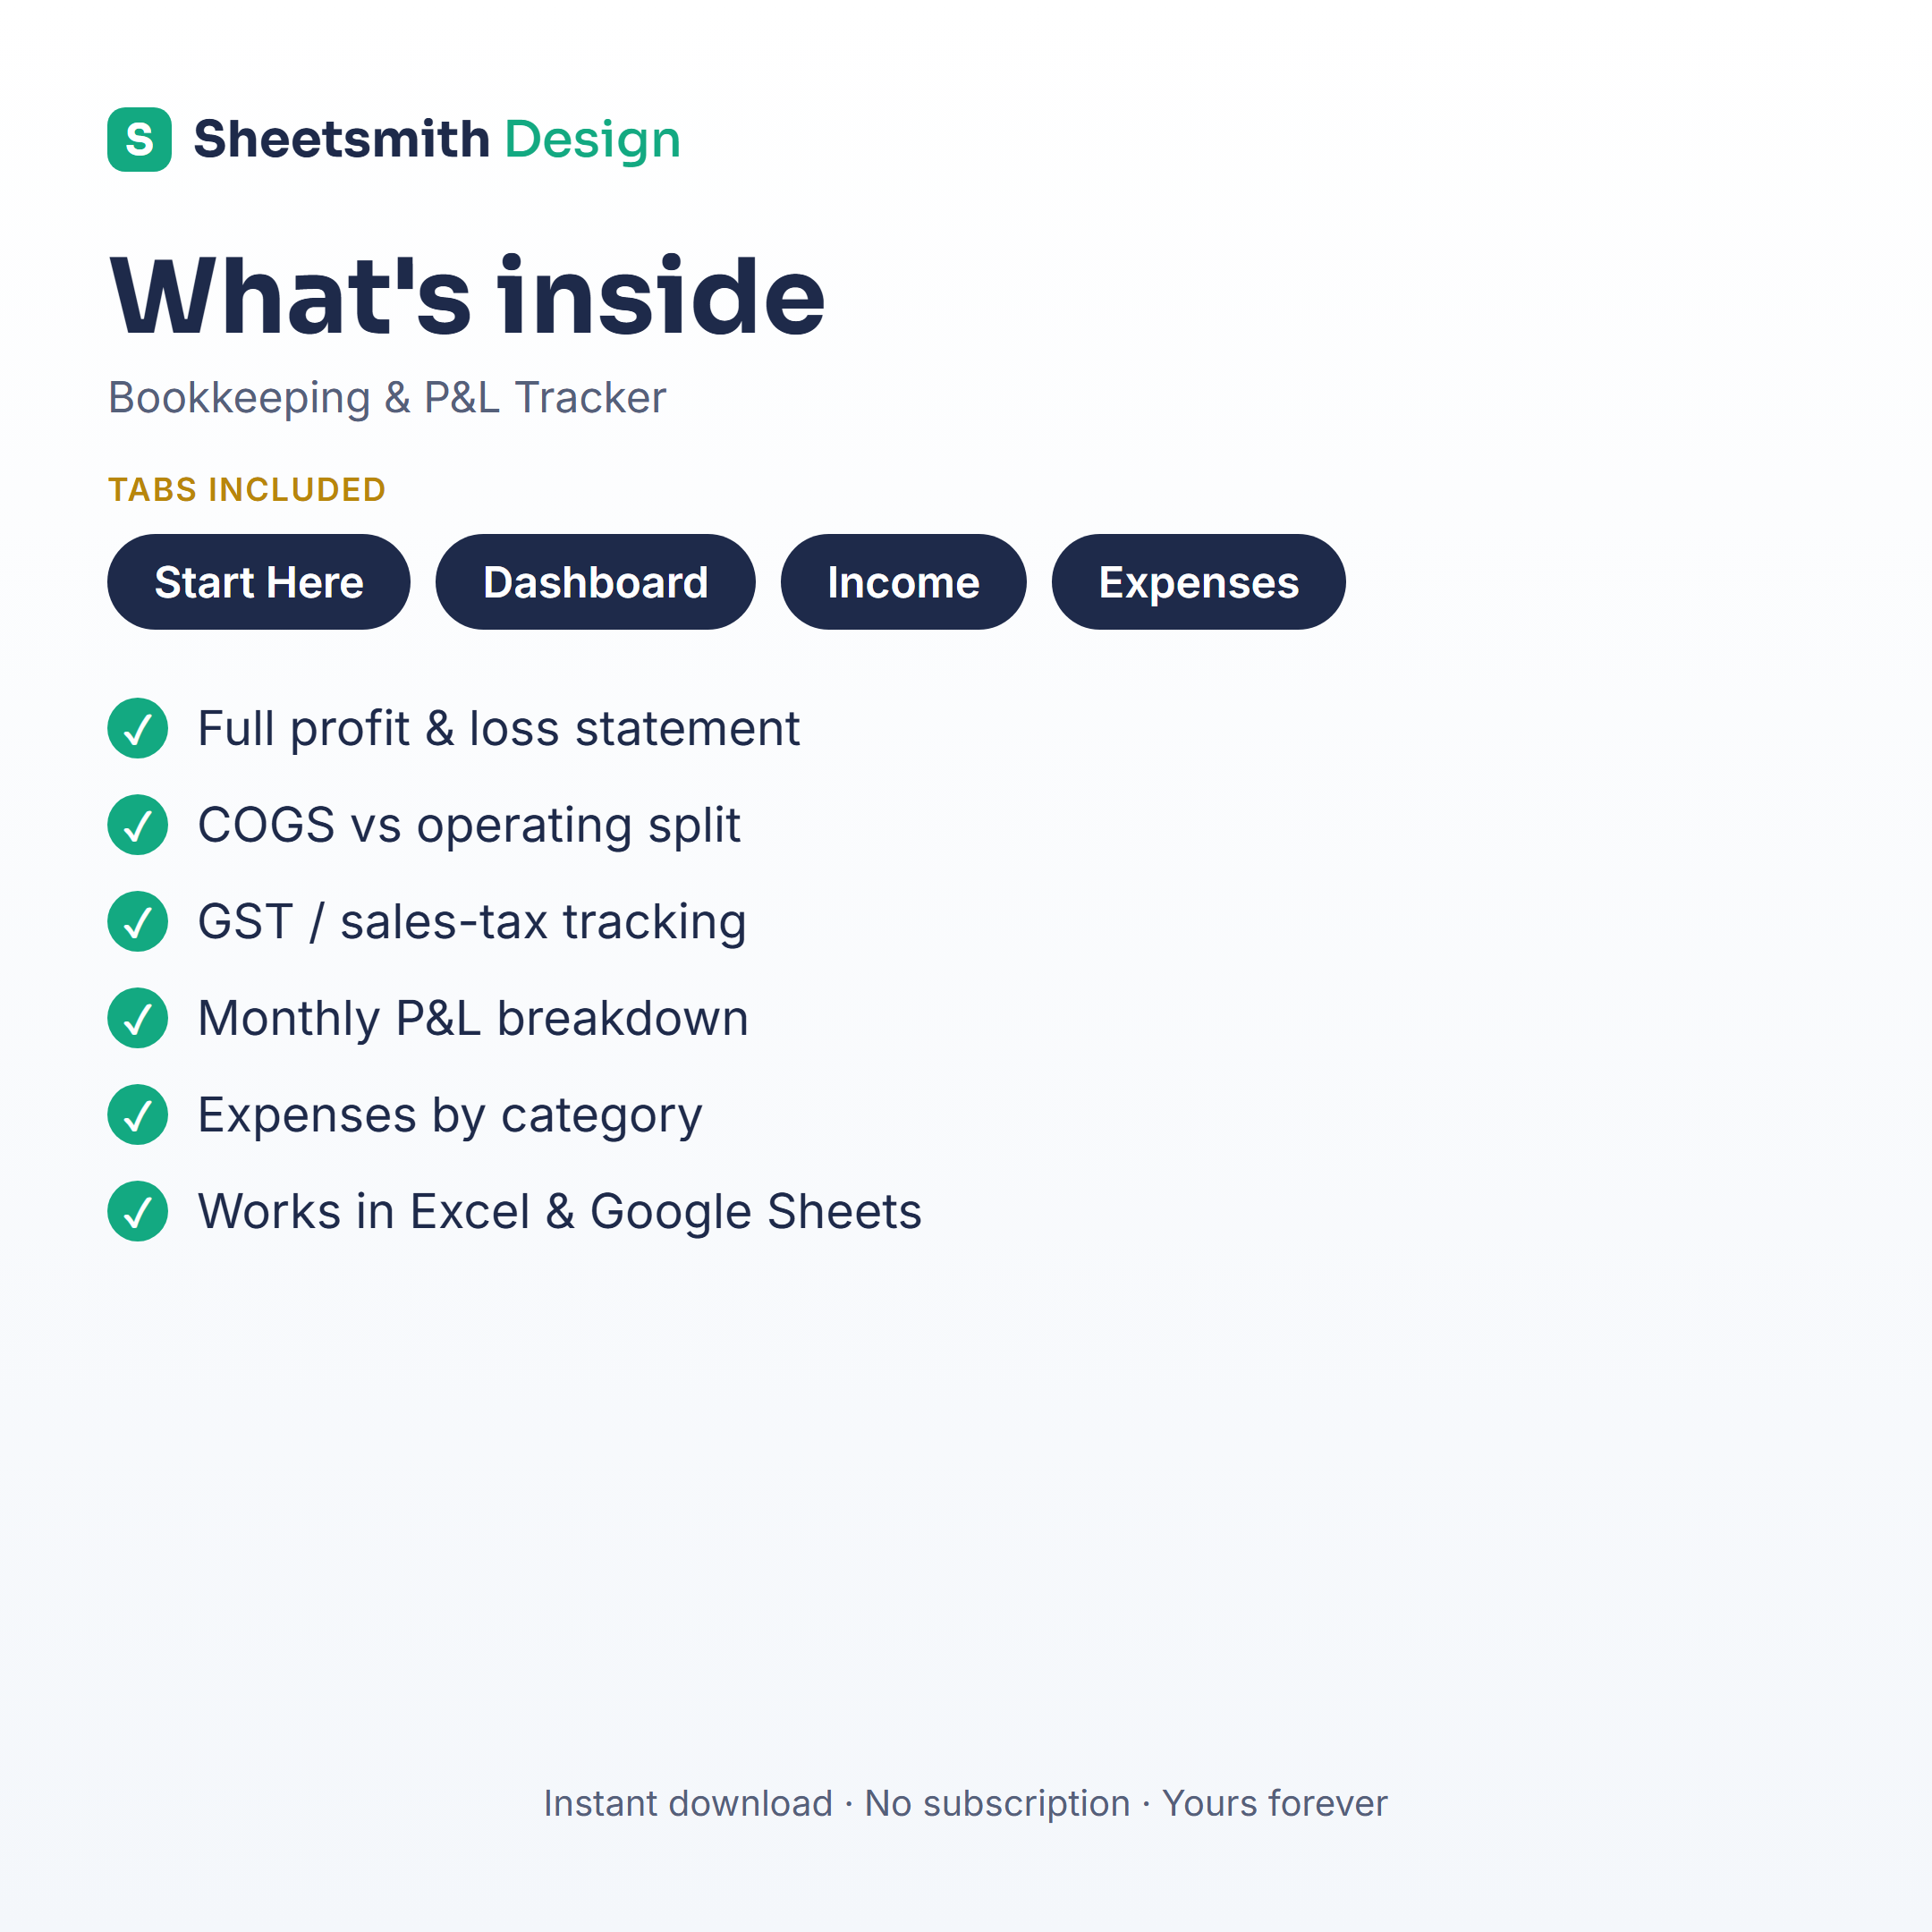
The Sheetsmith Bookkeeping & Profit-and-Loss Tracker is a full P&L that builds itself: Revenue → COGS → Gross Profit → Operating → Net, with GST/sales-tax tracking, a monthly P&L, expenses-by-category and charts. Log your sales and costs; it does the statement. Excel and Google Sheets, one-off download, no subscription.
General information and a spreadsheet walkthrough — not accounting or tax advice.